The headline number belongs to the entire pool
A dashboard reports heavy trading volume in a pool. A liquidity provider opens the position page and sees little new fee income. Both observations can be accurate. In a concentrated-liquidity design, a position specifies a price interval in which its assets support trades. Pool turnover aggregates trading across the pool, whereas the position participates according to where its liquidity was active during those trades. A daily volume figure alone omits that path through prices. A user comparing reported fees with a personal result should begin with the network, pair, exact pool and fee tier. Even pools displaying the same token symbols can describe different trading activity.
Walk through a price excursion
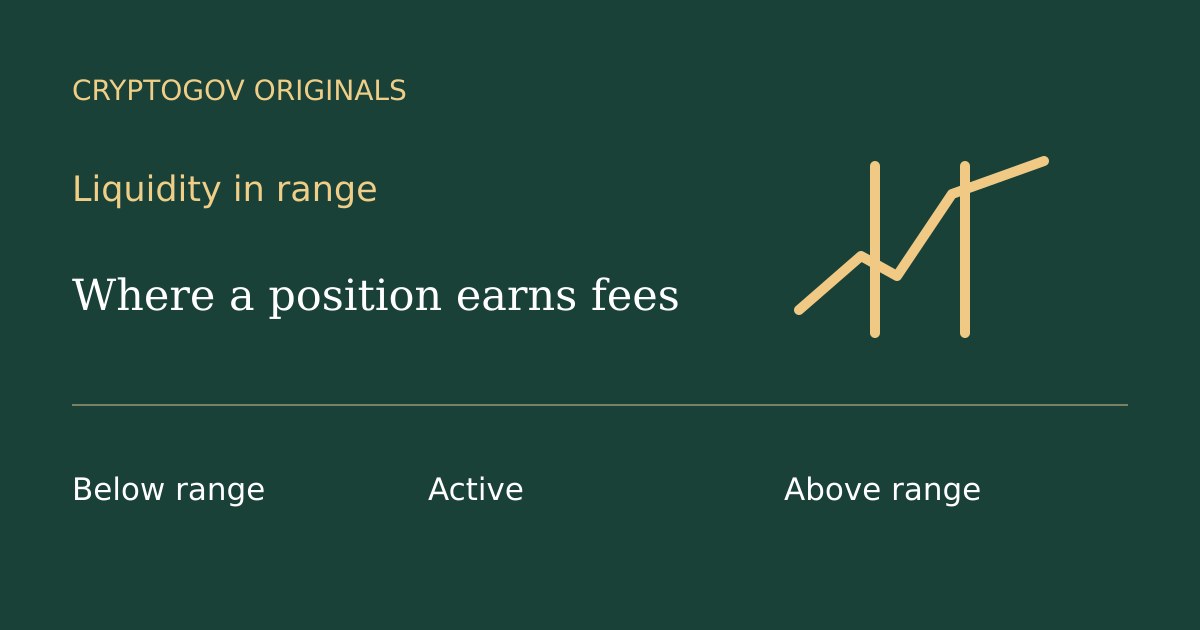
Consider an illustrative position that provides liquidity between prices of ninety and one hundred ten, expressed in the same quote asset throughout. The market begins at one hundred and later spends most of the session around one hundred twenty. Swaps while the price is outside the selected interval can add to reported pool volume without generating swap fees for that inactive position. When the market crosses the boundary, only the part of the trading path where the position is active matters for its participation. Returning inside the interval can restore participation. It does not retroactively allocate the outside volume. Narrowing a range therefore changes both the concentration of capital when active and the chance of sitting outside the market.
What a performance note should disclose
A defensible note separates fees accrued, fees collected and changes in the value of the inventory held. A position can collect fees and still lose value in the reporting currency. Record both token quantities at the beginning and end, the price convention used, and whether capital was withdrawn, added or repositioned. Include transaction costs if the comparison is intended to describe the owner’s outcome. For a benchmark, value the original quantities at the same closing prices. Then explain where the difference came from rather than extrapolating one busy day into a yearly return. The most useful missing field on a pool-volume screenshot is often mundane: how much of that period did this particular position actually spend in range?
For a comparison across two positions, use the same observation window and the same quote asset. Otherwise a daily fee figure from one pool and a weekly inventory change from another can create a ranking that no participant actually experienced.
Go deeper on CryptoGov
Sources & verification
Researched and published by CryptoGov Editorial Desk. Source publication and effective dates are explained in the article where relevant.